Plaso Super Timelines in Splunk

Splunk is a widely used platform for collecting, indexing, and reviewing logs from a plethora of sources. Most of the time it’s used for streaming data directly into the tool for this purpose. Data can be manually added to Splunk and in certain cases, that may be your best/only option.
In my previous blog here, we go over creating Plaso Super Timelines with the log2timeline tool, as well as exporting results from Plaso storage files using psort, while using the convenience of the Plaso Docker image.
The following write-up will go over output from that previous post so it can be ingested and reviewed in Splunk. Allowing you to take advantage of Splunk features for reviewing Plaso output. Continuing with Docker, we’ll use the Splunk Enterprise Docker image to quickly get up and running with our Splunk review platform.
Table of Contents
· Pulling the Splunk Enterprise Docker image
· Starting Splunk in Docker
· Accessing Splunk
· Plaso output
· Creating the Plaso JSONL Source Type
· Configuring Splunk for JSONL Data
∘ Set Source Type
∘ Index Creation
· Viewing the Data
· Final Thoughts
∘ Of Interest
∘ Your turn!
Prerequisites
Before we get started, make sure you have the following ready:
- Windows Operating System: Splunk Enterprise and Docker run smoothly on Windows, for our needs here.
- Docker Desktop: Install Docker Desktop to manage your containers through a user-friendly interface. Docker will serve as our isolated environment for running Splunk.
- Basic Understanding of Docker and PowerShell: Familiarity with Docker concepts and basic PowerShell commands will help you follow the setup and examples more easily.
- Sufficient Disk Space and Permissions: Ensure you have enough disk space for Docker images, containers, and the necessary permissions to install and run Docker applications.
Pulling the Splunk Enterprise Docker image
Step 1 — Open PowerShell: Start by opening your PowerShell interface. You can do this by searching for “PowerShell” in your Windows search bar and selecting “Run as Administrator” if necessary for elevated permissions, when working with Docker.
Step 2 — Pull the Docker Image: To download the Splunk Docker image, use the following command in your PowerShell prompt. This command pulls the latest version of the Splunk Docker image from Docker Hub, which contains all the necessary components per-configured for Splunk to run efficiently.
docker pull splunk/splunk:latestDepending on your internet speed, this might take a few minutes. Running this command on occasion will keep the Docker image updated with the latest version.
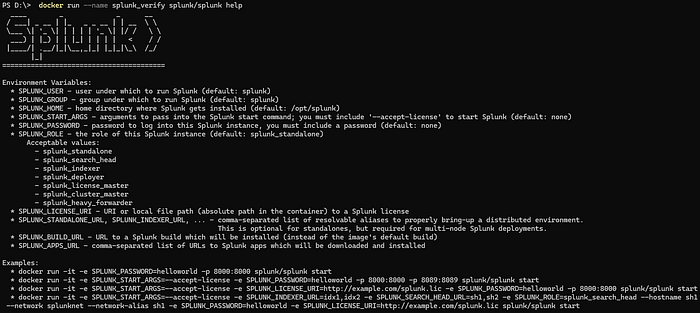
Step 3 — Verify the Installation: After the image has been downloaded, it’s a good practice to ensure that it was pulled correctly and is working as expected. You can verify this by checking the version of Splunk installed in the Docker image. Use the following command to check the version:
# Start a container named splunk_verify
docker run --name splunk_verify splunk/splunk help

# Remove the splunk_verify container
docker rm splunk_verify
Here’s what each part of the command does:
docker run --name splunk_verify: This command tells Docker to create a container name splunk_verify and run the container.splunk/splunk help: Specifies which Docker image to use and will show the Splunk logo, as well as how to setup commands for creating a Splunk instance.docker rm splunk_verify: This instructs docker to remove the splunk_verify container we just made. Optional step, but helps keep the container list cleaned up.
Starting Splunk in Docker
Once you have the Splunk Docker image downloaded and available, we need to start it up. The following command is written for PowerShell, in multi-line format. We’ll walk through the command and the options so you can see how this works to start up the Splunk Docker image.
# Command to copy & paste into PowerShell terminal
docker run -d --name plaso_splunk `
  --hostname plaso_splunk `
  -p 8000:8000 `
  -e SPLUNK_PASSWORD='password1' `
  -e SPLUNK_START_ARGS='--accept-license' `
  -v D:/Cases/BSidesAmman21:/data `
  splunk/splunk:latest
Explanation of Each Part
docker run -d: This command tells Docker to run a container in detached mode. Without -d the command line window has to stay open.--name plaso_splunk: This option assigns a name to the container, making it easier to reference. In this case, the container is namedplaso_splunk.--hostname plaso_splunk: Sets the host name inside the container toplaso_splunk. This is useful if you need to refer to the container by a specific name within its network.-p 8000:8000: This option maps port 8000 on your host machine to port 8000 on the container. This allows you to access the Splunk web interface by navigating tohttp://localhost:8000on your host machine.-e SPLUNK_PASSWORD='password1': This sets an environment variableSPLUNK_PASSWORDinside the container with the valuepassword1. Splunk uses this environment variable to set the admin password. Please use a stronger password if needed.-e SPLUNK_START_ARGS='--accept-license': This sets another environment variableSPLUNK_START_ARGSinside the container with the value--accept-license. This argument is used to automatically accept the Splunk license agreement on startup.-v D:/Cases/BSidesAmman21:/data: This mounts the local directoryD:/Cases/BSidesAmman21on your host machine to/datainside the container. This is used to provide access to data files that Splunk can index. We are using the data from a previous blog post.splunk/splunk:latest: This specifies the Docker image to use for the container.splunk/splunkis the official Splunk image from Docker Hub, andlatestspecifies that the latest version of the image should be used.
This Docker command runs a new container named plaso_splunk using the latest Splunk image. It maps port 8000 for accessing the Splunk web interface, sets the admin password, accepts the license agreement, and mounts a local directory for data access between the container and host. This setup allows you to easily configure and start a Splunk instance with custom settings and data accessible from your host machine.
Alternative Splunk Start
For those interested in the docker compose approach to starting up Splunk, here is the same setup, but for the docker-compose.yml file:
services:
  plaso_splunk:
    image: ${SPLUNK_IMAGE:-splunk/splunk:latest}
    container_name: plaso_splunk
    environment:
      - SPLUNK_START_ARGS=--accept-license
      - SPLUNK_PASSWORD=password1
    ports:
      - 8000:8000
    volumes:
      - D:/Cases/BSidesAmman21:/data
To use this, make sure you have Windows Docker Desktop installed, navigate in your terminal to the folder you have your docker-compose.yml file saved and use the following command:
docker-compose up -dAccessing Splunk
Once your Splunk Docker container is running, you can access the web interface. For the example we have, that is simply:
http://localhost:8000If your setup is different, you can go back to Docker Desktop, select the running docker container.

Docker will provide the web interface URL link to access Splunk.

From there you’re able to sign in with the credentials you provided. As provided in the example configuration above, our password is simply password1.
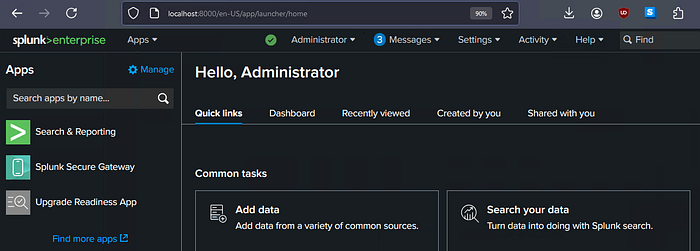
We now have access to our Splunk web interface. From here, we’ll take a look at our Plaso output so we get familiar with what we need to do to get our data into Splunk.
Plaso output
In the previous blog, we used Plaso psort to create a timeline in JSON-line format. Specifically, we created a file named BSidesAmman21-l2t.jsonl. Here is a sample screenshot of the data in its current form:

Unfortunately, this leaves us with data that is not-so-easy to review in its current form. Thus, Splunk! Splunk natively support JSON, among many other formats, and is fairly straight-forward to configure even for special forms of data.
Below is a sample record from our data, formatted from JSON-line to the pretty JSON format. There is something important to take note of here. There are two timestamp fields.
{
  "__container_type__": "event",
  "__type__": "AttributeContainer",
  "_event_values_hash": "4d4d93fb7a44fcd9b65e800bec6b88ef",
  "computer_name": "MSEDGEWIN10",
  "data_type": "windows:evtx:record",
  "date_time": {
    "__class_name__": "Filetime",
    "__type__": "DateTimeValues",
    "timestamp": 131946803165544449            # Timestamp 1
  },
  "display_name": "NTFS:\\Windows\\System32\\winevt\\Logs\\Security.evtx",
  "event_identifier": 4624,
  "event_level": 0,
  "event_version": 2,
  "filename": "\\Windows\\System32\\winevt\\Logs\\Security.evtx",
  "inode": "83684",
  "message": "TRUNCATED",
  "message_identifier": 4624,
  "offset": 0,
  "parser": "winevtx",
  "pathspec": {
    "__type__": "PathSpec",
    "location": "\\Windows\\System32\\winevt\\Logs\\Security.evtx",
    "mft_attribute": 2,
    "mft_entry": 83684,
    "parent": {
      "__type__": "PathSpec",
      "parent": {
        "__type__": "PathSpec",
        "location": "/data/Evidence/BSidesAmman21.E01",
        "type_indicator": "OS"
      },
      "type_indicator": "EWF"
    },
    "type_indicator": "NTFS"
  },
  "provider_identifier": "{54849625-5478-4994-a5ba-3e3b0328c30d}",
  "record_number": 2168,
  "recovered": false,
  "source_name": "Microsoft-Windows-Security-Auditing",
  "strings": ["TRUNCATED"],
  "tag": {
    "__container_type__": "event_tag",
    "__type__": "AttributeContainer",
    "labels": ["login_attempt"]
  },
  "timestamp": 1550206716554445,                  # Timestamp 2
  "timestamp_desc": "Content Modification Time",
  "xml_string": "TRUNCATED"
}
Timestamp 1 is a Windows FILETIME format (18 digits), as seen with __class_name__ value of Filetime.
- 131946803165544449
- GMT: Friday, February 15, 2019 4:58:36 AM
- This is a nice timestamp but unfortunately this class is not always a FILETIME format.
Timestamp 2 is a Unix Epoch microseconds format (16 digits)
- 1550206716554445
- GMT: Friday, February 15, 2019 4:58:36.554 AM
- This is a consistent timestamp across our data output.
Splunk is Epoch time friendly, so we will be targeting the second timestamp as our desired time for indexing. To do this, we’ll need to work with Splunk’s configuration by creating a custom source type configuration.
Creating the Plaso JSONL Source Type
At this point, I’ll assume you have Splunk working per the guide above and have logged in successfully.
Before we being uploading our data, we’ll create a custom source type configuration that will help Splunk index the data correctly.
To begin, select “Settings > Source types”, from the top menu.
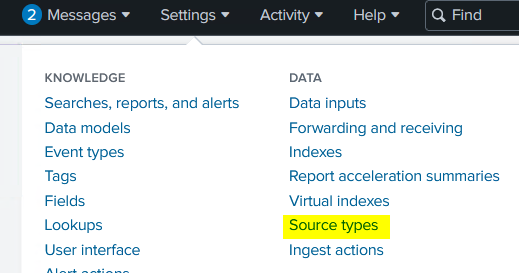
This will open the “Source Types” page where you can select “New Source Type”

We will use the following entries to describe our source type and to adjust the Timestamp settings.
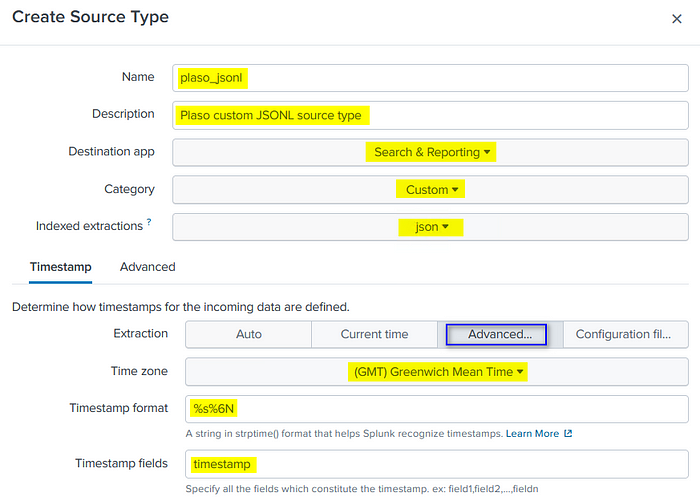
On the “Advanced” tab, select the “UTF-8” character set and use the “New setting” link to add rows and enter the remaining custom options. When finished select “Save” to save your Source Type configuration.

Here is a brief explainer of the options we are using.
CHARSET=UTF-8
- This defines the character encoding of the Plaso data as UTF-8.
INDEXED_EXTRACTIONS=json
- This instructs Splunk extract json fields and values and index them during ingestion.
KV_MODE=none
- This turns off additional key:value extraction. When enabled along with “INDEXED_EXTRACTIONS=json”, this can lead to some duplication in fields. Thus I recommend setting this to “none”.
TIMESTAMP_FIELDS=timestamp
- Defines the name of the field for Splunk to use for time-lining events. For our purposes, our timestamps field is simply named “timestamp”.
TIME_FORMAT=%s%6N
- Helps Splunk identify the format of the value in TIMESTAMP_FIELDS.
- This defines a Unix Epoch timestamp in microseconds (16-digits).
- Time format descriptions can be found here.
MAX_TIMESTAMP_LOOKAHEAD=16
- Tells Splunk to only look for a TIMESTAMP_FIELDS value that is 16 characters in length.
TZ=GMT
- Time zone setting
SHOULD_LINEMERGE=false
- This has Splunk treat each line from the JSONL file as a separate event.
LINE_BREAKER=([\r\n]+)
- Provides Splunk information to determine event boundaries.
TRUNCATE=0
- Useful for our case here, as some of the events can be lengthy, this helps keep them from being cut off and potentially not indexed.
We now have our plaso_jsonl source type saved and ready to use for data upload.

If you’re interested in the props.conf file stanza for plaso_jsonl, Here is how this looks when Splunk saves it into the props.conf file:
# props.conf stanza for the plaso_jsonl source type

[ plaso_jsonl ]
CHARSET=UTF-8
INDEXED_EXTRACTIONS=json
KV_MODE=none
MAX_TIMESTAMP_LOOKAHEAD=16
SHOULD_LINEMERGE=false
category=Custom
description=Plaso JSONL format
NO_BINARY_CHECK=true
LINE_BREAKER=([\r\n]+)
TIME_FORMAT=%s%6N
TZ=GMT
TIMESTAMP_FIELDS=timestamp
TRUNCATE=0
disabled=false
pulldown_type=true
Configuring Splunk for JSONL Data
Now that we’ve created our source type config for props.conf, we’ll go over the two methods to upload the data. I’ll explain the first portions of each method first, as most of the process is the same.
Note: There are certainly more than two ways to do this, but not for this post.
Method 1 — Web GUI Upload: We will start with this method, as this not only is a useful way to setup up the Splunk config, it’s also useful for testing some of your settings before uploading your data.
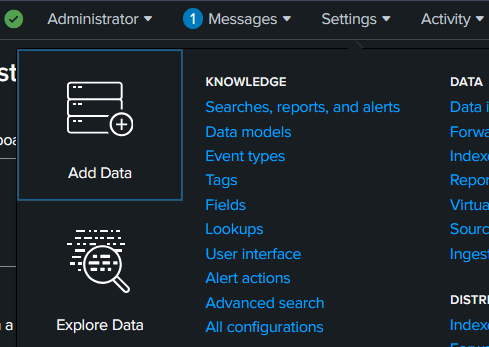
- To begin, select “Settings > Add Data”:
2. Select “Upload”:
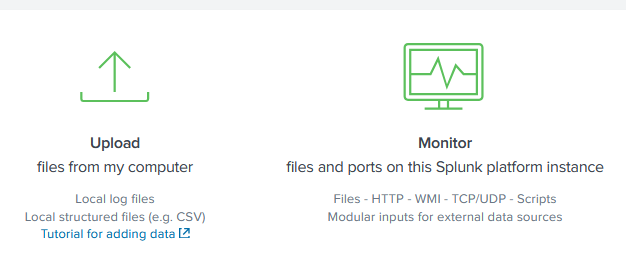
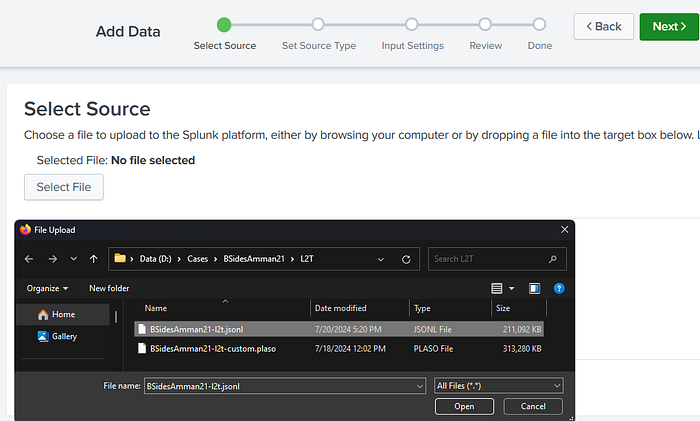
3. Select your jsonl data file with the Select File option, or drag your jsonl file into the browser window. Once uploaded, select “Next >”.
You should now be on the “Set Source Type” page, as seen below.
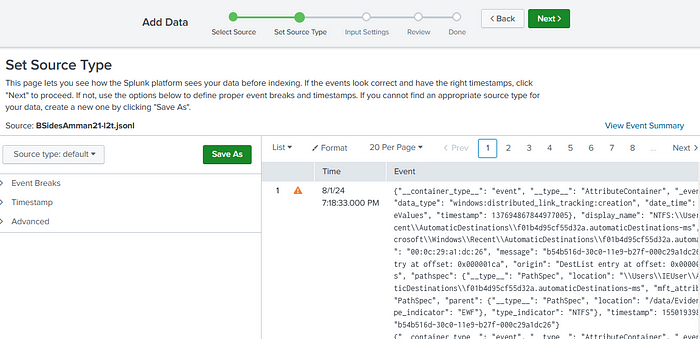
We’ll pause here to go over how to start the next method, as the steps are the same beyond this point.
Feel free to jump down to the “Set Source Type” section below to continue with the data upload by setting up your source type configuration or check out Method 2 next.
Method 2 — Data Monitor
This way may actually be more convenient when you have multiple files to upload or very large files. Since you can only upload one file at a time via the Web interface, not to mention the file size limit, it has. Though, no limits with the Monitor option, that I’m currently aware of.
- To begin, select Settings > Add Data:

2. Select Monitor:

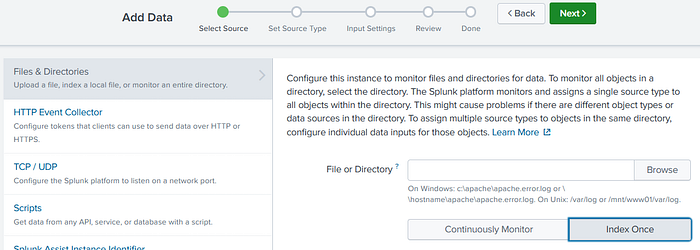
3. Select “Files & Directories”, then “Browse” to bring up the file or directory selector.
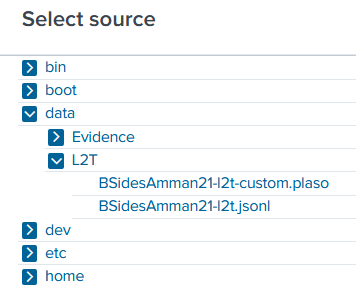
Recalling from our command to start Splunk, we mapped our local path to the Splunk “data” folder with -v D:/Cases/BSidesAmman21:/data. So in the pop-up, we’ll click data/L2T to see our jsonl file to select. Once the BSidesAmman21-l2t.jsonl file is selected, click on “Select” at the bottom of the pop-up. Then the “Next >” button at the top of the page to start working on your source type.
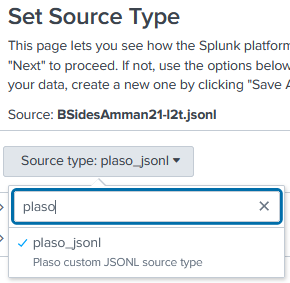
Set Source Type
Since we have already created out plaso_jsonl source type, on this page we will select the “Source type” drop-down and search plaso to see our custom configuration. Select it and watch the data transform!
We now have nice formed columns and our “_time” column shows the timestamp that we set in our configuration.
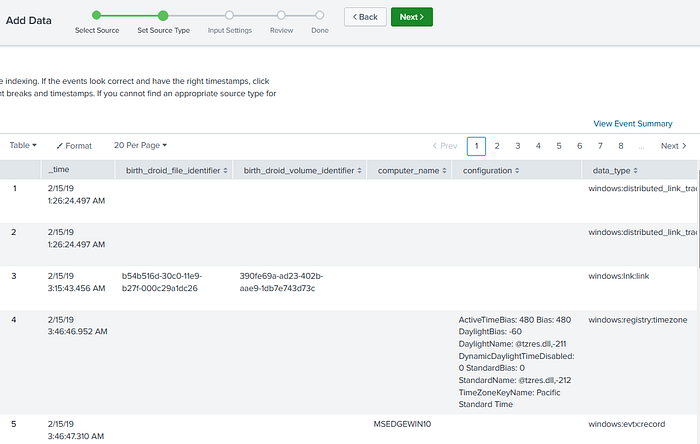
If you need to make adjustments from here, open the drop-downs in the left pane to add just “Timestamp” settings or other “Advanced” settings.
Once we’ve confirmed the data is looking right, we can select “Next >” at the top, to continue our data upload.
From here we get to the Input Settings screen. There is currently no need to adjust the Host information. However, we do need an index. So now select “Create a new index”.
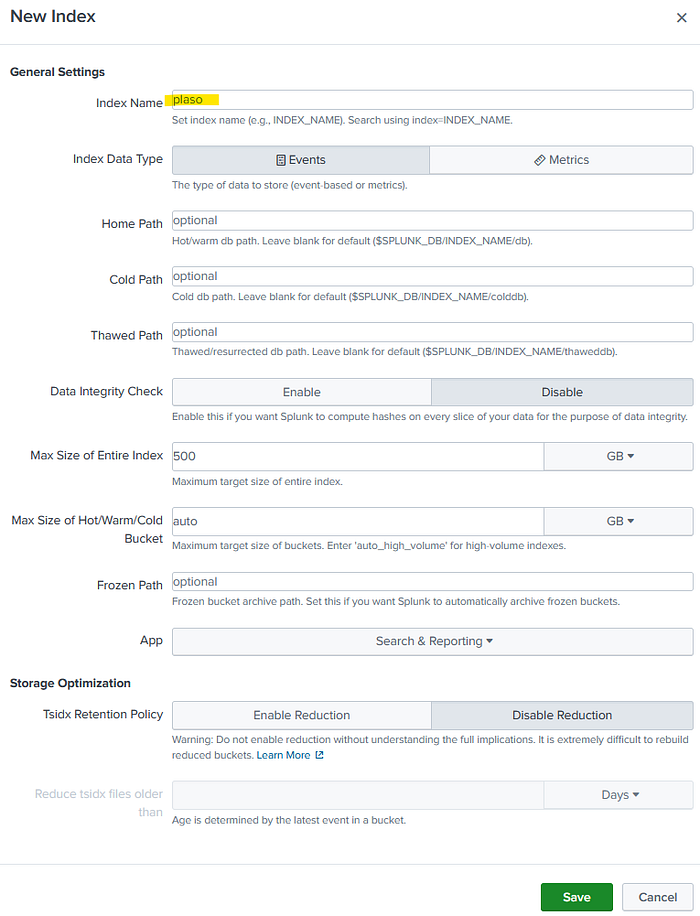
Index Creation
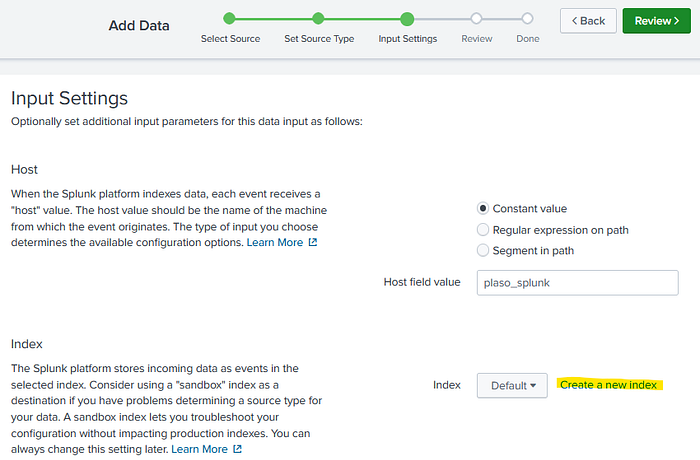
For our purposes, creating a new index is simple, despite the many options here, which I will not be going over. Here we will just add an “Index Name”. I’ve added simply, plaso. Once you’re ready, select Save.
After saving, make sure plaso is selected from the drop-down, on the Input Settings page and you’re ready to click on “Review >” at the top.

The next page is for reviewing your entries. If everything looks correct, then select “Submit >”.

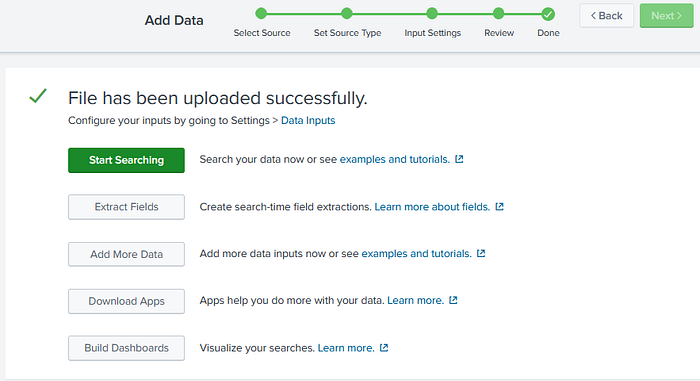
Lastly, once uploaded you can begin verification and analysis of the data by going straight to “Start Searching”.
Viewing the Data
Splunk will load the index and here we can verify our event count. We can see that 109,715 events were created in Splunk. Let’s compare that to our data set.
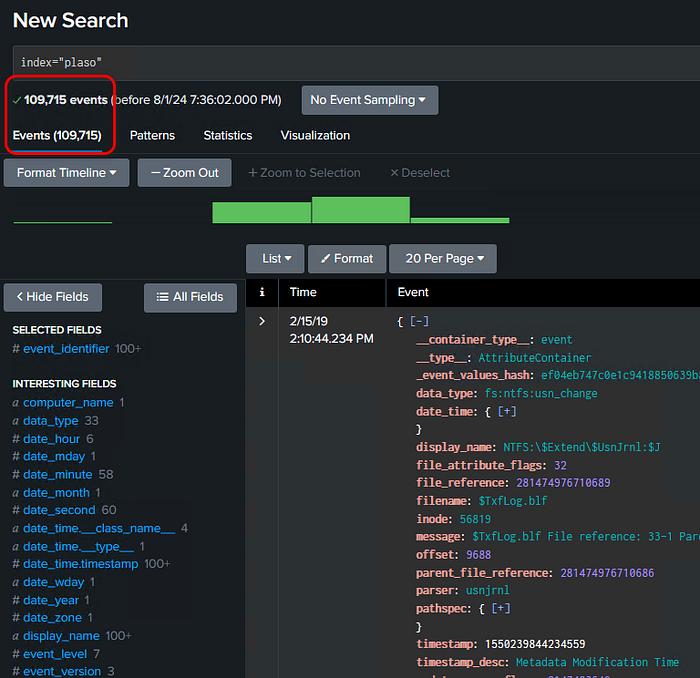
Running a line count on our jsonl file, we see the Splunk event count matches the number of events in our Plaso data file.
# PowerShell line count command
(Get-Content "BSidesAmman21-l2t.jsonl" `
  | Measure-Object -Line).Lines
Final Thoughts
Thanks for making it this far into my post! I’ve been on a side quest to better understand Splunk, so this seemed like a nice way to go through that and share some info along the way.
I’d love to hear your thoughts and ideas, so reach out and connect here or I’m on LinkedIn.
Of Interest
I’m also interested to hear if you have used Plaso in Splunk before. Some things I’m curious to learn more about:
- If there is a better way to extract the “xml_strings” data into columns dynamically at index-time, specifically. I’ve learned how through the transforms.conf and props.conf configurations, but it’s A LOT. Also through search-time extractions, though this leads to large complex queries.
- Fun queries, stats, visualizations, or dashboards you’ve come up with. There is SO much fun to be had here.
- Ways to exclude excessive fields, like “__container_type__”, “__type__”, etc., from the index, at index time.
- Other tips and tricks!
Your turn!
If you would like to experiment with this yourself, here is a link to the BSidesAmman21-l2t.jsonl file I am using. I’ve used 7zip to compress it.
Have fun!
